
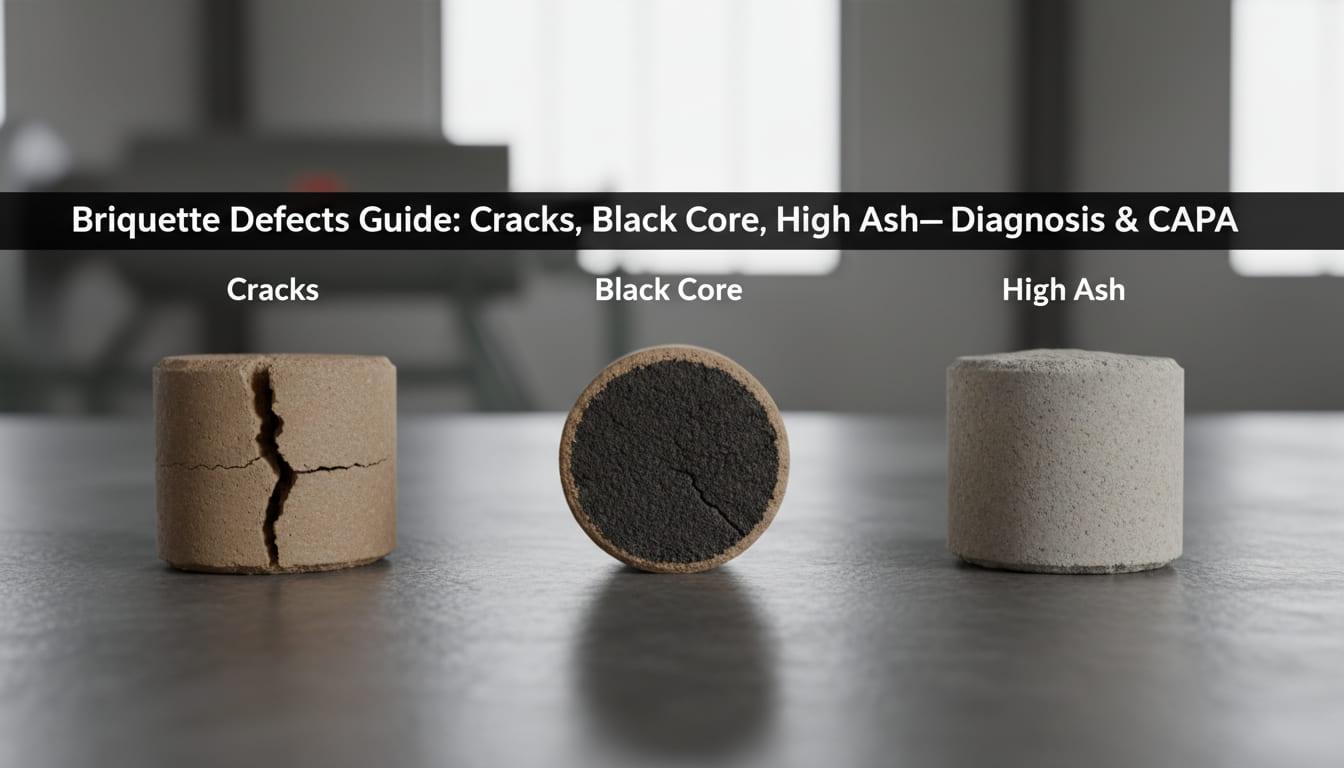
Coconut charcoal briquette defects reduce product value 15-40% through quality rejections, customer complaints, and increased breakage during handling, with surface cracks (affecting 8-12% of production), incomplete carbonization (5-8% black core defects), and high ash content (3-6% of batches) representing the most common manufacturing problems.
Systematic defect diagnosis using root cause analysis and corrective/preventive action (CAPA) protocols reduce defect rates to below 3% total while improving process consistency and customer satisfaction.
Understanding Briquette Quality Defects
Quality defects emerge from process variations, raw material inconsistencies, equipment malfunctions, and operator errors across carbonization, mixing, pressing, and drying operations. Each defect type creates specific customer impacts requiring targeted diagnosis and correction.
Primary Defect Categories:
- Visual/Structural Defects: Cracks, surface irregularities, dimensional variations, incomplete formation
- Composition Defects: Black core (incomplete carbonization), high ash content, moisture content deviations
- Performance Defects: Short burn time, difficult ignition, excessive smoke, structural weakness
- Contamination Defects: Foreign materials, chemical residues, mold growth
Impact on Business Operations:
Defects create cascading costs beyond immediate material loss:
- Quality rejections: 5-15% production waste requiring rework or disposal
- Customer complaints: Warranty claims, product returns, relationship damage
- Price discounting: 15-30% price reduction for second-quality products
- Brand reputation: Negative reviews and reduced customer loyalty
- Regulatory risk: Failed certifications or export documentation issues
A production facility generating 5 tons daily with 10% defect rate wastes 182 tons annually worth $273,000 at $1,500/ton pricing. Reducing defects to 3% recovers $191,000 annually while strengthening market positioning.
Defect 1: Surface Cracks and Fractures
Surface cracks represent the most visible briquette defect, affecting structural integrity, customer perception, and handling durability.
Visual Identification
Crack Classification:
Hairline Cracks (Minor):
- Width: <0.5mm visible surface cracks
- Depth: Surface layer only (1-2mm penetration)
- Impact: Cosmetic primarily, minimal strength reduction
- Acceptability: Often within tolerance for commercial-grade products
Moderate Cracks:
- Width: 0.5-2mm visible separation
- Depth: 3-6mm penetration into briquette
- Impact: 15-25% strength reduction, increased breakage during handling
- Acceptability: Borderline for standard grades, rejected for premium
Severe Cracks/Complete Fractures:
- Width: >2mm separation or complete splitting
- Depth: Full penetration creating separate pieces
- Impact: Structural failure, cannot be packaged or shipped
- Acceptability: Always rejected, requires rework or disposal
Root Cause Analysis
Cause 1: Excessive Drying Speed
Mechanism: Rapid surface moisture evaporation creates differential shrinkage between outer layers and interior core. Surface contracts faster than interior, generating tensile stress exceeding briquette tensile strength.
Contributing Factors:
- Solar drying in direct sunlight without shading (temperatures above 45°C)
- Kiln drying at excessive temperatures (>90°C for coconut charcoal)
- Low ambient humidity (<30%) accelerating evaporation rate
- Forced-air drying with excessive airflow velocity
Verification Methods:
- Compare crack incidence across different drying locations/methods
- Monitor surface vs core moisture content during drying
- Document ambient temperature and humidity conditions
- Test drying rate (% moisture loss per hour)
Cause 2: Insufficient Binder Content
Mechanism: Inadequate binder percentage fails to provide tensile strength resisting shrinkage stresses during drying. Charcoal particles lack sufficient adhesive bonding.
Contributing Factors:
- Binder percentage below 6% for standard formulations
- Degraded binder quality (age, moisture absorption, contamination)
- Incomplete binder distribution during mixing
- Binder type unsuitable for charcoal particle characteristics
Verification Methods:
- Test binder percentage in cracked vs intact briquettes (dissolve and separate)
- Examine binder distribution uniformity under microscope
- Compare formulations with different binder levels
- Verify binder quality specifications (starch content, moisture, purity)
Cause 3: High Initial Moisture Content
Mechanism: Excessive moisture in pressed briquettes (>18%) requires greater total shrinkage during drying, increasing crack probability. Higher shrinkage generates greater internal stress.
Contributing Factors:
- Water addition during mixing exceeds formula specification
- High base charcoal moisture (>5%) not accounted in formula
- Humid production environment affecting binder moisture content
- Inadequate moisture measurement or control systems
Verification Methods:
- Measure moisture content in freshly pressed briquettes
- Track water addition accuracy during mixing
- Test base charcoal moisture entering mixing process
- Calculate total moisture budget (charcoal + binder + water addition)
Cause 4: Over-Pressing (Excessive Compression)
Mechanism: Extremely high pressing pressure (>200 bar for coconut charcoal) compresses binder excessively, creating brittle structure prone to crack propagation during handling and drying.
Contributing Factors:
- Press pressure settings above optimal range
- Die cavity design creating pressure concentration zones
- Particle size distribution with excessive fines (<0.5mm) requiring high pressure for formation
- Equipment malfunction causing pressure spikes
Verification Methods:
- Monitor actual press pressure with calibrated gauges
- Test briquette density (over-pressed shows >1.1 g/cm³ for coconut charcoal)
- Examine briquette cross-section for over-compaction indicators
- Compare crack rates at different pressure settings
Corrective Actions (Immediate)
Action 1: Modify Drying Protocol
Reduce drying speed preventing differential shrinkage:
- Reduce kiln temperature from 80-90°C to 60-70°C
- Shade solar drying racks preventing direct sun exposure
- Increase ambient humidity in drying area (water misting systems)
- Extend total drying time allowing gradual moisture removal
Implementation timeline: Immediate (same-day adjustment) Expected improvement: 40-60% crack reduction within 24-48 hours
Action 2: Adjust Formula Binder Content
Increase binder percentage providing crack resistance:
- Raise binder from current level to 7-8% (trial batches)
- Verify binder quality meets specifications before increase
- Test incrementally (0.5% increases) finding optimal level
- Balance crack reduction against cost increase
Implementation timeline: 1-2 days for trial batches Expected improvement: 30-50% crack reduction at optimal binder level
Action 3: Reduce Initial Moisture
Lower moisture content in pressed briquettes:
- Decrease water addition by 1-2% during mixing
- Pre-dry base charcoal to <3% moisture before mixing
- Improve binder storage preventing moisture absorption
- Calibrate moisture measurement equipment
Implementation timeline: Immediate adjustment possible Expected improvement: 25-40% crack reduction
Action 4: Optimize Press Pressure
Reduce compression to appropriate level:
- Decrease press pressure by 10-20 bar increments
- Test briquette formation quality at reduced pressure
- Find minimum pressure achieving adequate density (0.95-1.05 g/cm³)
- Document optimal pressure settings for each briquette size/shape
Implementation timeline: Same production day testing Expected improvement: 20-35% crack reduction
Preventive Actions (Long-term)
Prevention 1: Establish Drying Parameter Controls
Implement systematic drying management:
- Document standard drying temperatures, times, and humidity ranges
- Install temperature and humidity monitoring in drying areas
- Create drying protocol SOPs with visual training materials
- Schedule regular calibration of drying monitoring equipment
Prevention 2: Raw Material Quality Standards
Control binder and charcoal specifications:
- Establish binder acceptance criteria (starch content, moisture, particle size)
- Test incoming binder batches before production use
- Qualify multiple binder suppliers providing backup sources
- Monitor charcoal powder moisture content before mixing
Prevention 3: Process Parameter Documentation
Record critical process variables enabling trend analysis:
- Batch production records tracking all formula components
- Mixing time, pressing pressure, and drying conditions for each batch
- Defect rates correlated with process parameters
- Statistical process control charts identifying parameter drift
Prevention 4: Operator Training Program
Ensure consistent execution across all shifts:
- Standard operating procedures for mixing, pressing, drying
- Visual defect recognition training with example specimens
- Troubleshooting decision trees for common problems
- Cross-training between operators preventing knowledge concentration
Defect 2: Black Core (Incomplete Carbonization)
Black core defects indicate insufficient carbonization where briquette interiors retain brown or black uncarbonized material versus properly carbonized gray-black charcoal.
Visual Identification
Detection Methods:
Cross-Section Examination: Break briquettes revealing interior color and structure:
- Proper carbonization: Uniform gray-black throughout cross-section
- Mild incomplete carbonization: Dark brown core (10-20mm diameter)
- Severe incomplete carbonization: Black woody core (>20mm diameter) with distinct color boundary
Burn Testing: Ignite suspected briquettes observing combustion characteristics:
- Proper carbonization: Uniform glowing, consistent burn rate throughout
- Incomplete carbonization: Uneven burning, sections failing to ignite, excessive smoke from uncarbonized volatiles
Density Variation: Incomplete carbonization creates density inconsistency:
- Properly carbonized: 0.95-1.05 g/cm³ uniform density
- Black core defect: Higher density in core (1.1-1.3 g/cm³) from retained organic structure
Root Cause Analysis
Cause 1: Insufficient Carbonization Temperature
Mechanism: Kiln temperatures below 450°C fail to complete pyrolysis reactions, leaving organic structures partially intact. Complete carbonization requires sustained 500-600°C temperatures.
Contributing Factors:
- Kiln fuel shortage or improper loading preventing temperature achievement
- Temperature measurement errors (thermocouple placement, calibration drift)
- Excessive coconut shell loading creating cold zones
- Inadequate kiln insulation causing heat loss
Verification Methods:
- Monitor actual kiln temperatures with calibrated thermocouples at multiple positions
- Record temperature profiles throughout carbonization cycle
- Compare black core incidence with documented kiln temperatures
- Conduct heat distribution mapping identifying cold zones
Cause 2: Insufficient Carbonization Duration
Mechanism: Short carbonization cycles (<4 hours at temperature) prevent heat penetration to shell core. Large shell pieces require extended time for complete pyrolysis.
Contributing Factors:
- Rushed production schedules reducing hold time
- Incomplete understanding of carbonization time requirements
- Shell size variation with large pieces (>100mm) requiring longer cycles
- Premature kiln cooling before full carbonization completion
Verification Methods:
- Document actual carbonization time from ignition to cooling
- Correlate black core incidence with cycle duration
- Test carbonization completeness at different time intervals
- Examine shell size distribution entering carbonization
Cause 3: Excessive Shell Moisture
Mechanism: High moisture content in coconut shells (>15%) consumes heat energy for water evaporation, preventing temperature rise necessary for carbonization. Wet shells in kiln center never reach pyrolysis temperature.
Contributing Factors:
- Rainy season shell collection without drying
- Inadequate shell storage allowing moisture absorption
- Fresh shell processing without drying period
- Groundwater-soaked shells from poor storage drainage
Verification Methods:
- Measure incoming shell moisture content before carbonization
- Compare carbonization outcomes across different shell moisture levels
- Monitor shell storage conditions and drainage
- Test correlation between shell moisture and black core incidence
Cause 4: Poor Airflow Distribution
Mechanism: Inadequate oxygen control creates incomplete combustion zones where pyrolysis reactions stall. Excessive oxygen causes charcoal combustion; insufficient oxygen prevents temperature generation.
Contributing Factors:
- Blocked air inlet dampers or poorly maintained kiln doors
- Uneven shell loading creating dense zones restricting airflow
- Improper kiln design with inadequate air distribution
- Chimney draft problems from blockage or insufficient height
Verification Methods:
- Measure oxygen concentration at different kiln positions (2-4% target)
- Inspect airflow pathways for blockages or restrictions
- Test smoke color and density indicating combustion completeness
- Map temperature distribution correlating with airflow patterns
Corrective Actions (Immediate)
Action 1: Increase Carbonization Temperature
Raise kiln operating temperature ensuring complete pyrolysis:
- Add additional fuel achieving 550-600°C sustained temperature
- Repair insulation reducing heat loss
- Improve combustion air supply enhancing fuel burning efficiency
- Install additional thermocouples verifying temperature distribution
Implementation timeline: Next carbonization batch (same day possible) Expected improvement: 70-90% black core elimination if temperature was root cause
Action 2: Extend Carbonization Time
Lengthen hold period allowing complete pyrolysis:
- Increase carbonization duration from current time to 6-8 hours minimum
- Monitor shell center temperature ensuring adequate heat penetration
- Delay cooling phase until temperature uniformity confirmed
- Adjust production scheduling accommodating longer cycles
Implementation timeline: Next batch (immediate implementation) Expected improvement: 60-80% defect reduction for time-related issues
Action 3: Reduce Shell Moisture
Pre-dry coconut shells before carbonization:
- Spread shells in sunlight for 2-3 days reducing moisture to <10%
- Use covered drying areas protecting from rain
- Reject excessively wet shell deliveries
- Install moisture meters for incoming shell testing
Implementation timeline: 2-3 days for shell drying Expected improvement: 50-70% improvement for moisture-related defects
Action 4: Improve Airflow Management
Optimize oxygen distribution throughout kiln:
- Clean air inlet dampers and chimney removing blockages
- Load kiln with consistent density avoiding tight packing
- Adjust damper settings achieving proper draft
- Repair kiln doors ensuring proper seal during carbonization
Implementation timeline: 4-8 hours for kiln maintenance Expected improvement: 40-60% defect reduction
Preventive Actions (Long-term)
Prevention 1: Carbonization Parameter Standards
Document and enforce carbonization requirements:
- Minimum temperature: 500°C for 4 hours, 550°C optimal
- Maximum shell moisture: 12% at kiln loading
- Standard carbonization cycle: 6-8 hours active pyrolysis
- Quality check procedures: Break test on samples from each batch
Prevention 2: Shell Quality Control
Establish incoming material standards:
- Moisture content testing: Reject batches >15% moisture
- Shell size specification: Limit maximum piece size to 80mm
- Storage protocol: Covered, elevated platforms with drainage
- Supplier qualification: Consistent quality from approved sources
Prevention 3: Kiln Maintenance Schedule
Systematic equipment upkeep preventing performance degradation:
- Monthly: Thermocouple calibration verification
- Quarterly: Refractory lining inspection and repair
- Bi-annually: Airflow measurement and optimization
- Annual: Complete kiln rebuild if needed for structural integrity
Prevention 4: Quality Assurance Testing
Implement systematic defect detection:
- Sample testing: Break 5-10 briquettes per production batch examining cross-section
- Proximate analysis: Monthly volatile matter testing (high VM indicates incomplete carbonization)
- Burn testing: Weekly performance verification under standard conditions
- Customer feedback tracking: Monitor complaints related to burn characteristics
Defect 3: High Ash Content
Elevated ash content reduces burn performance, increases cleanup requirements, and signals quality control problems in raw materials or processing.
Identification and Measurement
Laboratory Testing:
Standard ash content determination (ASTM D1762):
- Burn 1-2 gram sample at 650°C for 3-4 hours
- Measure remaining mineral residue
- Calculate ash percentage: (Ash weight / Sample weight) × 100
Quality Thresholds:
- Premium grade: <2.0% ash content
- Standard commercial: 2.0-3.5% ash content
- Economy grade: 3.5-5.0% ash content
- Rejected/substandard: >5.0% ash content
Field Assessment:
Visual post-burn evaluation:
- Burn 10-15 briquettes completely in controlled test
- Collect and weigh residual ash
- Compare volume and weight to historical baselines
- Assess ash color (white/gray = normal; dark/black = incomplete combustion)
Root Cause Analysis
Cause 1: Raw Material Contamination
Mechanism: Soil, sand, or foreign materials mixed with coconut shells introduce non-combustible mineral content increasing final ash percentage.
Contributing Factors:
- Ground-collected shells accumulating soil particles
- Outdoor shell storage without covering exposing to rain splashing
- Supplier harvesting practices allowing contamination
- Inadequate washing before carbonization
Verification Methods:
- Test ash content on shells before carbonization (should be 1-2%)
- Visual inspection of shell deliveries for visible soil/sand
- Wash sample batches comparing ash content washed vs unwashed
- Audit supplier collection and storage practices
Cause 2: Equipment Contamination
Mechanism: Processing equipment introduces foreign materials through wear, improper cleaning, or residual materials from previous production.
Contributing Factors:
- Crusher/grinder wear releasing metal particles into charcoal
- Kiln brick dust contaminating carbonized charcoal
- Conveyor belt deterioration shedding rubber particles
- Inadequate equipment cleaning between production batches
Verification Methods:
- Magnetic separation testing capturing metal contamination
- Ash chemical analysis identifying contamination sources (high iron = metal wear; high silicon = soil/sand)
- Visual inspection of processing equipment for wear or damage
- Pre/post equipment ash testing isolating contamination points
Cause 3: Incomplete Carbonization
Mechanism: Partially carbonized material retains higher ash percentages than fully carbonized charcoal. Incomplete pyrolysis fails to volatilize certain mineral compounds.
Contributing Factors:
- Low carbonization temperature (<500°C) preventing complete mineral transformation
- Short carbonization time inadequate for volatile release
- Uneven carbonization creating brown-core material with elevated ash
Verification Methods:
- Correlate ash content with volatile matter percentage (high VM + high ash indicates incomplete carbonization)
- Fixed carbon calculation: Low fixed carbon (<70%) suggests carbonization problems
- Visual inspection for brown or black core indicating incomplete processing
Cause 4: Binder Mineral Content
Mechanism: Binders containing mineral additives or contamination contribute ash to final product. Pure starches contribute <0.1% ash; contaminated or adulterated binders add 0.5-1.5% ash.
Contributing Factors:
- Low-quality binder with mineral fillers (calcium carbonate, clays)
- Contaminated binder from improper storage or handling
- Excessive binder percentage (>10%) magnifying mineral contribution
- Binder specifications inadequate regarding purity
Verification Methods:
- Test binder ash content independently (burn pure binder sample)
- Calculate binder contribution: (Binder % × Binder ash %) = Expected ash increase
- Compare formula variations with different binder types
- Request binder supplier specifications and certificates of analysis
Corrective Actions (Immediate)
Action 1: Implement Shell Washing
Remove soil and contamination from raw materials:
- Install simple water spray washing system for incoming shells
- Agitate shells in water removing loose particles
- Drain and partially dry before carbonization
- Monitor ash content improvement in washed vs unwashed batches
Implementation timeline: 2-3 days for washing system setup Expected improvement: 0.5-1.5% ash reduction (30-50% of soil contamination) Cost: $500-1,500 for basic washing equipment
Action 2: Equipment Maintenance and Cleaning
Eliminate process contamination sources:
- Inspect and repair worn crusher blades and grinder components
- Clean kiln removing brick dust and accumulated residues
- Replace deteriorated conveyor belts
- Establish daily equipment cleaning procedures
Implementation timeline: 1-2 days for equipment service Expected improvement: 0.3-0.8% ash reduction Cost: $200-800 for repairs and replacement parts
Action 3: Binder Quality Upgrade
Switch to pure food-grade binder specifications:
- Source tapioca or corn starch with <0.1% ash content
- Test binder samples before purchasing bulk quantities
- Establish supplier quality requirements and testing protocols
- Consider premium binder even at 10-15% cost increase
Implementation timeline: 1-2 weeks for new supplier qualification Expected improvement: 0.3-0.6% ash reduction Cost: $10-20 per ton additional binder cost
Action 4: Carbonization Optimization
Ensure complete pyrolysis reducing ash percentage:
- Increase carbonization temperature to 550-600°C
- Extend carbonization time to 6-8 hours
- Improve airflow distribution for uniform processing
- Monitor volatile matter percentage (target 12-18%)
Implementation timeline: Next carbonization batch Expected improvement: 0.2-0.5% ash reduction through complete carbonization Cost: Increased fuel consumption $5-10 per ton
Preventive Actions (Long-term)
Prevention 1: Supplier Quality Requirements
Establish incoming material standards:
- Maximum acceptable shell ash content: 2.0% (dry basis)
- Washing/cleaning requirements for suppliers
- Storage condition specifications preventing contamination
- Monthly supplier quality audits with sampling
Prevention 2: Systematic Quality Testing
Implement comprehensive monitoring program:
- Weekly ash content testing on production batches
- Monthly proximate analysis (complete moisture, ash, VM, fixed carbon)
- Quarterly supplier material testing verifying consistency
- Statistical process control tracking ash content trends
Prevention 3: Equipment Preventive Maintenance
Scheduled maintenance preventing contamination:
- Monthly crusher blade inspection and sharpening
- Quarterly kiln cleaning and refractory maintenance
- Bi-annual conveyor system overhaul
- Continuous magnetic separation at crusher output
Prevention 4: Process Documentation
Standardize operations reducing variation:
- Raw material acceptance criteria and testing procedures
- Carbonization parameter ranges (temperature, time, airflow)
- Equipment maintenance schedules and procedures
- Quality testing protocols with acceptance limits
Read: Binder Science for Briquettes: Tapioca and Alternatives
Defect 4: Dimensional Variations and Formation Problems
Briquette size inconsistency and incomplete formation create packaging difficulties, customer dissatisfaction, and quality perception issues.
Common Formation Defects
Undersized Briquettes:
- Dimension: 5-10% smaller than specification (23-24mm vs 25mm cubes)
- Cause: Insufficient material feed to press cavities, worn dies, low pressing pressure
- Impact: Packaging problems, customer complaints, perception of short-weighting
Oversized Briquettes:
- Dimension: 5-10% larger than specification (26-27mm vs 25mm cubes)
- Cause: Excessive material feed, die expansion from wear, formula moisture changes
- Impact: Packaging difficulties, shipping weight increase, potential customer rejection
Incomplete Formation:
- Appearance: Missing corners, surface voids, density variations
- Cause: Inadequate die filling, pressing pressure variations, material bridging in hopper
- Impact: Structural weakness, increased breakage, visual quality issues
Surface Irregularities:
- Appearance: Rough texture, pitting, attached material fragments
- Cause: Die wear, improper die release, moisture content problems
- Impact: Reduced premium appearance, dust generation during handling
Root Cause Analysis
Die Wear and Damage:
Progressive wear affects dimensional accuracy:
- Cavity dimension changes: 0.5-2mm expansion over 50,000-100,000 cycles
- Surface roughness increase: Scoring and pitting from abrasive charcoal
- Corner rounding: High-stress areas degrade faster
Verification:
- Measure die cavities with precision calipers (monthly)
- Inspect surface condition under magnification
- Compare briquettes from different die positions (worn vs new cavities)
Material Flow Problems:
Inconsistent cavity filling creates formation defects:
- Hopper bridging: Material arches preventing flow to dies
- Uneven distribution: Some cavities receive more material than others
- Particle size issues: Large particles block cavity entry; excessive fines reduce flowability
Verification:
- Observe feeding behavior during production
- Measure material level in each cavity before pressing
- Test particle size distribution (should be 70%+ in 0.5-3mm range)
Moisture Content Variation:
Moisture affects material compressibility and die release:
- Low moisture (<10%): Material too dry, poor formation, rough surface
- High moisture (>18%): Material too wet, sticking in dies, incomplete release
- Variation within batch: Creates mixed defects across production run
Verification:
- Test moisture content in fresh-pressed briquettes (target 12-15%)
- Monitor water addition accuracy during mixing
- Check mixer performance ensuring homogeneous moisture distribution
Corrective and Preventive Actions
Die Maintenance Program:
Immediate Actions:
- Inspect dies weekly measuring critical dimensions
- Re-machine or replace dies exceeding ±2mm tolerance
- Polish die surfaces removing roughness and scoring
- Rotate die blocks positioning worn cavities to low-use positions
Long-term Prevention:
- Establish die replacement schedule based on cycle count (100,000-150,000 cycles)
- Maintain spare die inventory (2-3 complete sets)
- Use hardened steel or chrome-plated dies for longer service life
- Document die performance tracking wear rates
Material Flow Optimization:
Immediate Actions:
- Install vibration on hopper preventing bridging
- Adjust material feed rate ensuring consistent cavity filling
- Optimize particle size distribution through screen adjustment
- Level material manually ensuring equal cavity distribution
Long-term Prevention:
- Install automatic feed leveling systems
- Implement particle size monitoring (weekly screening analysis)
- Design hopper angles preventing material bridging (60° minimum)
- Regular cleaning preventing material buildup
Moisture Control System:
Immediate Actions:
- Calibrate moisture meters used in quality control
- Install water flow meters for accurate mixing water addition
- Test and adjust base charcoal moisture before mixing
- Verify mixer performance distributing moisture uniformly
Long-term Prevention:
- Automated water addition based on moisture measurement
- Climate-controlled production area (50-70% humidity, 20-25°C)
- Binder moisture specifications (<12% maximum)
- Statistical process control tracking moisture variation
Read: Indonesia vs Vietnam Coconut Charcoal Export: Why Indonesia Dominates
Implementing CAPA (Corrective and Preventive Action) Systems
Systematic defect management requires structured investigation, correction, and prevention processes.
CAPA Process Framework
Step 1: Defect Identification and Documentation
Establish clear defect reporting:
- Defect description: Type, severity, quantity affected
- Discovery point: Where in process defect was identified
- Date and shift: When defect occurred
- Reporter: Operator or inspector name
- Photographic evidence: Visual documentation of defect
Step 2: Immediate Containment
Prevent defective product from reaching customers:
- Quarantine affected batch: Physical segregation with clear labeling
- Stop production: If defect indicates ongoing problem
- Customer notification: If defective product already shipped
- Rework evaluation: Determine if material can be recovered
Step 3: Root Cause Investigation
Systematic problem analysis:
- “5 Why” analysis: Iteratively ask why until root cause identified
- Fishbone diagram: Categorize potential causes (materials, methods, machines, manpower, environment)
- Data collection: Gather measurements supporting or refuting hypotheses
- Timeline reconstruction: Document events leading to defect occurrence
Step 4: Corrective Action Implementation
Address immediate root cause:
- Action plan: Specific steps to eliminate identified root cause
- Responsibility assignment: Name individual accountable for implementation
- Timeline: Target completion date with milestones
- Resource allocation: Budget, materials, labor required
- Verification testing: Confirm corrective action effectiveness
Step 5: Preventive Action Development
Prevent recurrence and identify systemic improvements:
- Process modification: Update procedures addressing root cause
- Training enhancement: Educate operators on proper execution
- Inspection addition: Install checkpoints catching similar defects
- Equipment upgrade: Replace or improve machinery preventing recurrence
- Documentation update: Revise SOPs, work instructions, training materials
Step 6: Effectiveness Verification
Confirm CAPA success:
- Monitor defect rates: Track improvement over 4-8 week period
- Statistical analysis: Confirm reduction is significant (not random variation)
- Customer feedback: Verify perceived quality improvement
- Process capability: Calculate Cpk demonstrating improved control
Step 7: Documentation and Closure
Complete CAPA record:
- Investigation summary: Root cause findings
- Actions taken: Corrective and preventive measures implemented
- Results achieved: Quantified defect reduction
- Lessons learned: Knowledge for future problem-solving
- Closure approval: Management sign-off confirming completion
CAPA Documentation Template
CAPA Reference Number: CAPA-2024-001 Date Opened: [Date] Reported By: [Name] Department: Production
Problem Description: Surface cracks affecting 12% of production (240 kg daily losses) observed on 2kg briquette products. Cracks appearing during drying phase, rendering products non-saleable.
Immediate Containment:
- Quarantined 2,400 kg cracked product for rework evaluation
- Notified packaging department to hold shipments pending investigation
- Implemented 100% visual inspection on drying output
Root Cause Analysis:
- Method: 5-Why Analysis + Fishbone Diagram
- Finding: Excessive drying temperature (85-90°C) causing rapid surface moisture loss
- Supporting Data: Crack incidence 18% at 85-90°C vs 3% at 60-70°C (historical data)
- Root Cause: Kiln temperature controller malfunction + inadequate operator training
Corrective Actions:
- Repair kiln temperature controller (Responsibility: Maintenance, Completion: 2024-01-15)
- Reduce drying temperature to 60-70°C (Responsibility: Production Lead, Immediate)
- Install backup temperature monitoring (Responsibility: Maintenance, Completion: 2024-01-20)
Preventive Actions:
- Establish monthly temperature controller calibration (Responsibility: Maintenance, Ongoing)
- Update drying SOP with temperature ranges and troubleshooting (Responsibility: QA, Completion: 2024-01-25)
- Operator training on temperature monitoring and defect prevention (Responsibility: Production Manager, Completion: 2024-02-01)
Verification Results:
- Week 1 post-correction: Crack rate 4.2% (65% improvement)
- Week 2 post-correction: Crack rate 2.8% (77% improvement)
- Week 4 post-correction: Crack rate 2.1% (82% improvement)
- Statistical significance: p<0.01 confirming sustained improvement
Closure: CAPA closed 2024-02-15. Corrective actions eliminated root cause; preventive actions prevent recurrence. Estimated annual savings: $131,400 from defect reduction.
Approved By: Production Manager, Quality Manager Date: 2024-02-15
Read: Self-Heating Treatment (SHT) Certified vs Non-Certified Charcoal
Defect Prevention Through Process Control
Proactive quality management prevents defects rather than reacting to problems.
Statistical Process Control (SPC)
Critical Parameter Monitoring:
Track key variables affecting quality:
- Moisture content: Daily testing on mixed batches (target 12-15% ± 2%)
- Pressing pressure: Hourly pressure gauge readings (target 130 bar ± 10 bar)
- Drying temperature: Continuous monitoring (target 65°C ± 5°C)
- Briquette weight: Hourly sampling 10 pieces (target 25g ± 2g)
Control Chart Implementation:
Visualize process stability:
- Plot parameter values over time
- Calculate upper and lower control limits (UCL/LCL)
- Identify out-of-control conditions:
- Single point outside control limits
- 7+ consecutive points on one side of centerline
- Increasing or decreasing trends over 6+ points
Process Capability Analysis:
Measure process performance:
- Cpk calculation: (Specification limit – Process mean) / (3 × Standard deviation)
- Interpretation:
- Cpk > 1.33: Process capable and well-controlled
- Cpk 1.00-1.33: Process marginally capable, improvement needed
- Cpk < 1.00: Process incapable, corrective action required
Quality Assurance Checkpoints
Incoming Material Inspection:
- Coconut shell moisture, contamination, size
- Binder quality specifications
- Reject non-conforming materials before production
In-Process Inspection:
- Carbonization: Temperature verification, visual shell examination
- Mixing: Moisture content, visual homogeneity
- Pressing: Dimensional checks, formation quality, weight
- Drying: Temperature monitoring, moisture testing
Finished Product Testing:
- Visual appearance: Cracks, color uniformity, dimension
- Physical testing: Burn time, ash content, breakage resistance
- Laboratory analysis: Proximate analysis on weekly composite samples
Continuous Improvement Culture
Quality Meetings:
- Weekly production quality review
- Monthly defect trend analysis
- Quarterly process improvement planning
- Annual quality system audits
Operator Involvement:
- Defect reporting systems with operator input
- Suggestion programs rewarding improvement ideas
- Cross-functional problem-solving teams
- Recognition for quality achievements
Knowledge Management:
- Defect photo library for training
- Root cause database for reference
- Best practices documentation
- Lessons learned sharing across shifts
Economic Impact of Defect Reduction
Case Study: 5-Ton Daily Production Facility
Pre-CAPA Implementation (Baseline):
- Total defect rate: 11.5% (cracks 8%, black core 2%, high ash 1.5%)
- Daily defect loss: 575 kg × $1.50/kg = $862.50
- Annual defect cost: $314,812
- Customer complaints: 15-20 per quarter
- Quality reputation: Moderate concerns from buyers
Post-CAPA Implementation (12 months):
- Total defect rate: 2.8% (cracks 1.5%, black core 0.8%, high ash 0.5%)
- Daily defect loss: 140 kg × $1.50/kg = $210
- Annual defect cost: $76,650
- Annual savings: $238,162
- Customer complaints: 2-3 per quarter (85% reduction)
- Quality reputation: Strengthened, enabling 3-5% price premium
CAPA Program Investment:
- Equipment upgrades (temperature controllers, moisture meters): $8,500
- Staff training programs: $3,200
- Quality testing expansion: $2,800 annually
- Total investment: $14,500
- ROI: 1,542% first year (10-week payback period)
Beyond direct savings, defect reduction enabled market positioning upgrade from “standard commercial” to “premium quality,” supporting $75-125/ton price increase across product line generating additional $137,000-228,000 annual revenue.
Read: Coconut Charcoal vs. Wood Charcoal: Performance, Sustainability & Cost Breakdown
Systematic Defect Management Delivers Quality Excellence
Coconut charcoal briquette defects including surface cracks (8-12% incidence), black core from incomplete carbonization (5-8%), and high ash content (3-6% of batches) reduce product value 15-40% through rejections, customer complaints, and quality perception damage. Structured CAPA systems combining root cause analysis, corrective action implementation, and preventive control protocols reduce total defect rates from 10-15% to below 3% within 8-12 weeks while generating $200,000-300,000 annual savings for medium-scale operations.
Successful defect management requires systematic investigation using 5-Why analysis and fishbone diagrams identifying true root causes, immediate corrective actions addressing identified problems, and long-term preventive measures through process control, operator training, and equipment maintenance. Statistical process control monitoring critical parameters (moisture content, pressing pressure, drying temperature) prevents defects through early detection of process drift before quality problems emerge.
Our production facilities maintain comprehensive CAPA systems documenting 50+ defect investigations over three years, achieving sustained 2-3% total defect rates through systematic problem-solving and continuous improvement. We provide CAPA program development, root cause analysis training, and quality system implementation support for manufacturers establishing defect management capabilities.
Contact us to discuss your quality challenges and develop customized defect reduction strategies.